Key figures
Client assets
in CHF million
58’004
Net new money inflow
in CHF million
4’963
Number of accounts
574’274
Net profit
in CHF million
217.6
2023 | 2022 | Change | Change in % | |||||
| in CHF thousand, except where indicated | ||||||||
Operating income | 530’869 | 408’146 | 122’723 | 30.1 | ||||
| Operating expenses | 270’936 | 214’957 | 55’979 | 26.0 | ||||
| Operating profit | 255’437 | 186’387 | 69’050 | 37.0 | ||||
| Operating profit margin in % | 48.1 | 45.7 | ||||||
| Net profit | 217’630 | 157’394 | 60’236 | 38.3 | ||||
| Net profit margin in % | 41.0 | 38.6 | ||||||
| Total equity | 898’555 | 741’128 | 157’427 | 21.2 | ||||
| % of equity/total assets | 9.9 | 8.2 | ||||||
| Earnings per share | 14.62 | 10.51 | 4.11 | 39.1 | ||||
| Core capital ratio in % | 25.1 | 24.8 | 0.3 | 1.2 | ||||
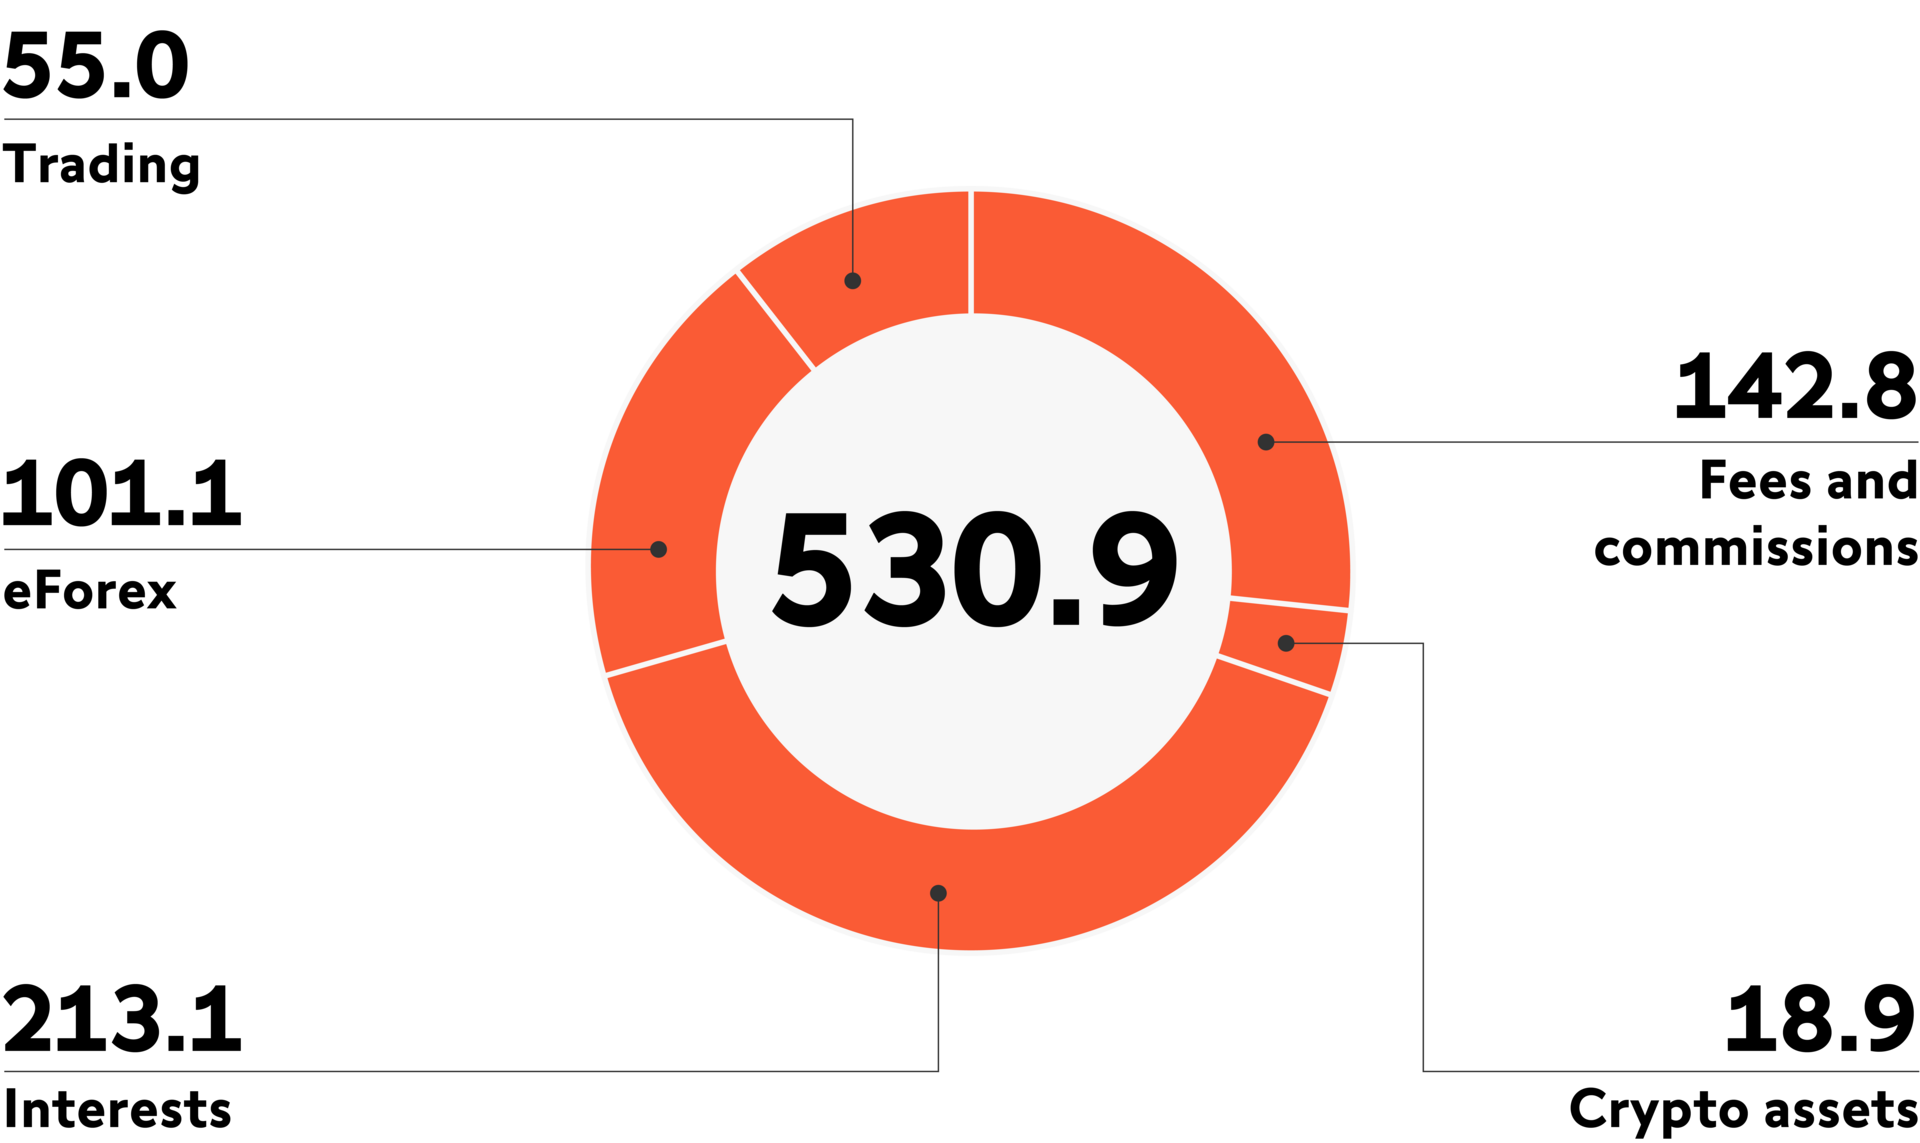
Operating income
in CHF million

Chart
Generator
% for Switzerland, Luxembourg and Dubai, representing approximately 94% of the Group workforce
% for Switzerland, Luxembourg and Dubai, representing approximately 94% of the Group workforce
